


1. What is an infographic?
Basically an infographic is a graphic that is designed to be able to communicate complex ideas in a simple way. Now, the simple is often more complicated to carry out.
How to make the complex simple? Are there any tricks to getting it?
Complex ideas have to be presented visually as a schematic illustration, being fundamental, that at a glance we can get a general idea of what we want to communicate. Thus we will get in a very simple way that can be understood and memorized, or at least fix or retain in memory concepts or data that otherwise would need a lot of space and resources to be explained and would not reach the same level of understanding.
2. Creating an infographic. Where do we start?
The first thing to do before approaching the task of creating an infographic is to ask yourself what is most important and what is the secondary of the information you want to transmit. It would be something like making a schematic summary with words of content. That is, organizing ideas into themes and sub-themes. Creating a kind of concept map.
1. Detect the conflict.
During this process of organizing ideas, we have to understand very well the message we want to convey.
An infographic is essentially a storytelling tool.
Almost always an infographic, you need to answer a series of questions, that is, the infographic is created to answer a problem, to explain in a simple way what is complicated.
So one of the most important tasks to do before you start making an infographic would be to focus on the problem. Identify what the problem is and make the whole infographic revolve around that problem, or somehow make the graphic elements that we use to illustrate the problem appear centralized in our composition or hierarchized so that they are the most important and immediate.
This organization of content in a hierarchical way will help us at the time of designing the infographic to stand out through graphic tools (scale, color, contrast…etc.) what is paramount and what is less important.
”
<h4><em>«Some starting points to detect the conflict when creating a story: - Express a doubt. - Think of a destabilizing idea. - Identify obstacles for users.»</em></h4>
Guillaume Lamarre.Storytelling como estrategia de comunicación. GG.

2. Organizing the space.
Once the story script is created, we establish each of the parts of our story based on the space that they could occupy in the infographic. These parts would be:
- The conflict or problem.
- The product or solution to it.
- Some practical example explaining how the problem would be solved.
1. Title and presentation of the problem.
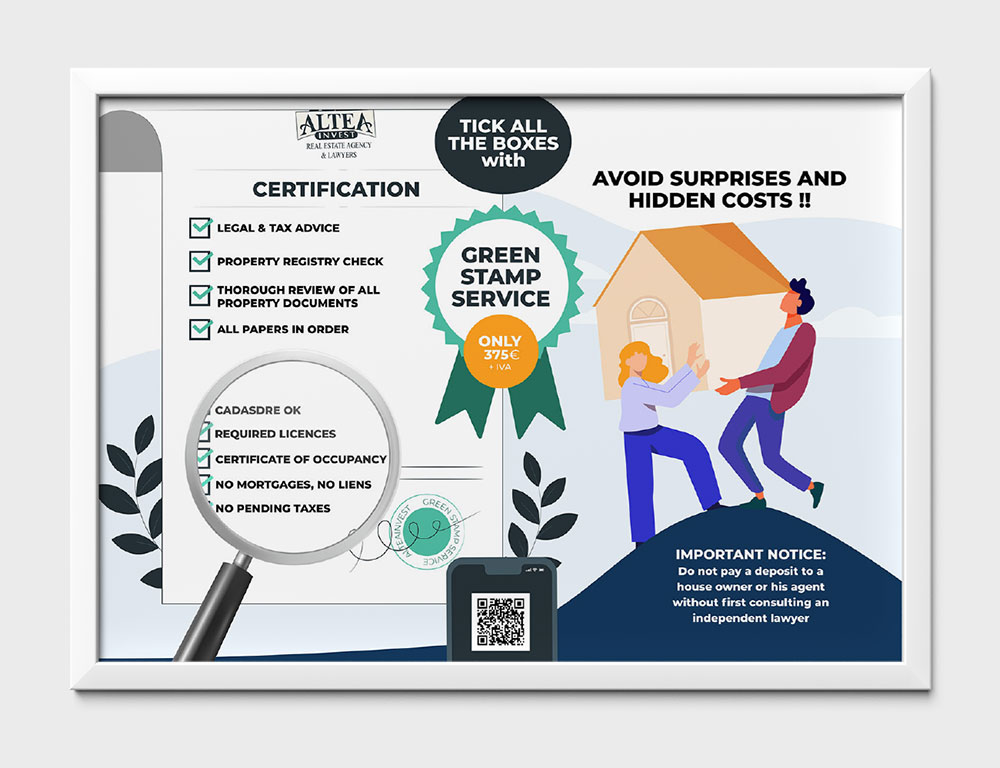
This infographic made for Alteainvest , for example, started from the initial idea of conflict as a fundamental premise of the story. The title of the infographic refers to the problem that the client has during the process of buying a property where it can be found with a series of expenses that are often hidden in documents and in contracts for real estate purchase.
The conflict is presented and the solution is presented around it.
2. Presentation of the product, its price and motto.
The name of the product and its price together with a motivating motto or a call to action that helps describe the development of history, are placed at the center of the composition.
3. Explanation of the benefits.
It explains how the product would work or what features it has that would solve the user’s problem. To graphically illustrate characteristics of a product, you can use graphic elements such as a checkbox listing or magnifying glass that allows you to go further and verify the “small print” of a document.
4. More information.
A QR code is added that links to a website indicating how to get the product.
3. Types of infographics. Themes.
If we look at examples of infographics created we will see that there are different types of infographics according to the topic they deal with. The most common types are:
- Explanation of a concept.
- Explanation of a product, technology…
- Presentation of a document, an event…
- Geographic data. Visual maps.
The type of infographic sometimes determines the graphic tools that are going to be used, so it is interesting to know in which category the infographic we want to make is.
Explanation of a concept .
Informative infographic for persuasive and educational purposes.
A striking image is worth a thousand dates.
Contrasting colors are used that are related to a clinical aesthetic and breaks with the stereotypical and conventional presentation of this type of awareness ads.
Also noteworthy is the graphic element of the scale to express visual hierarchy, emphasis and variety, as well as depth, movement and tension in the composition.
The image of the weapon is much greater than the slogan and the statistical data which confers even greater drama to the whole.
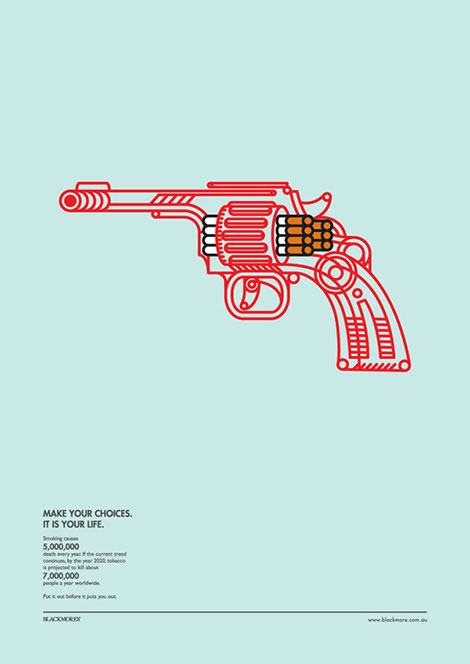
Designer / Llow Hong Chun
Explanation of a product .
When you need to explain how a product works very well lists (as we have seen before) or exposing the “pros and cons” of using or not using the product. But when what needs to be explained is complex, the most interesting method is the use of the sequence or process. It is usually used in infographics that aim to divulge how it is done or how it is something.
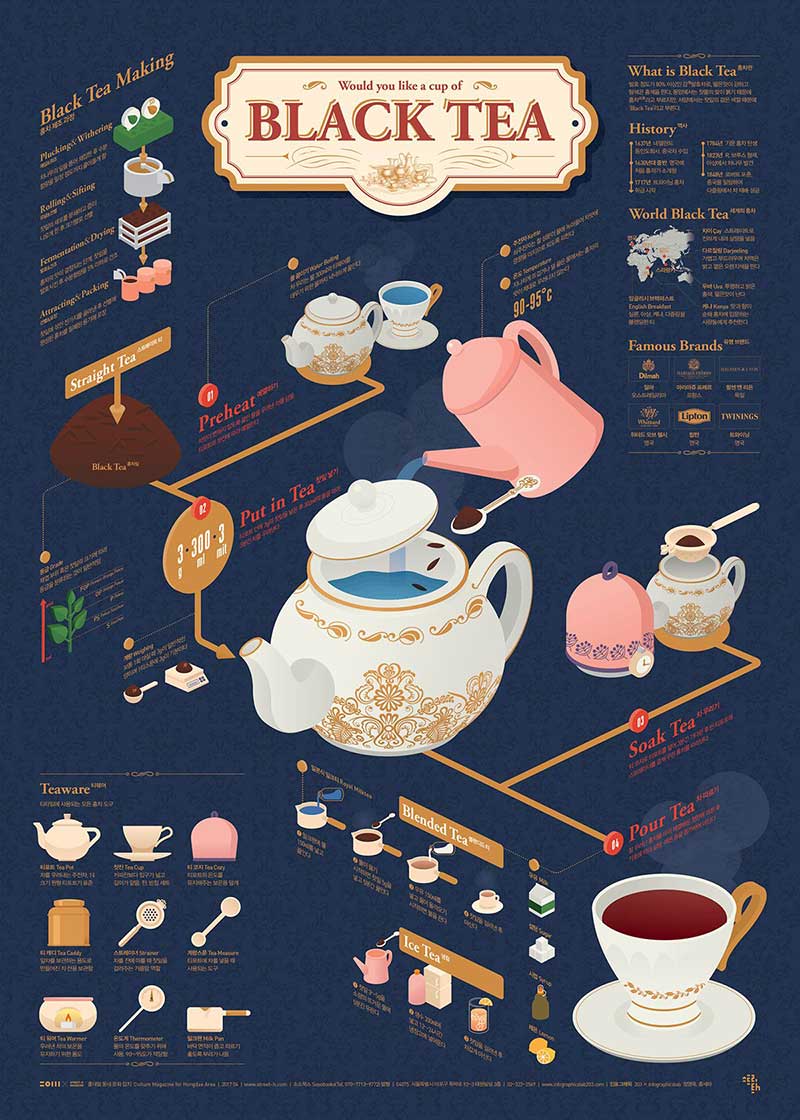
Design studio / 203 X Infographics Lab
Visual maps.
They are maps that also serve to locate geographic places to expose facts, events, chronologies… In this typology the infographic displays all its art. For this, graphic elements and illustrations are used that direct the viewer’s gaze and facilitate an orderly reading of the document.
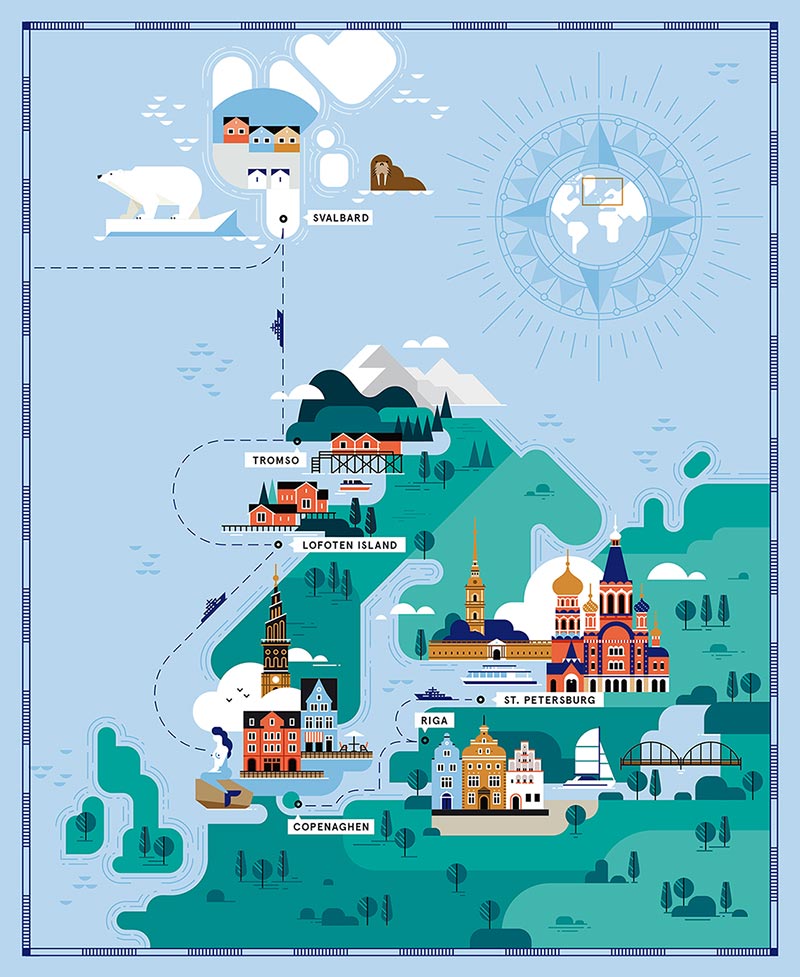
Designer / Olga Günther
Infographics awaken in us a taste for discovering, for playing. To observe an infographic is to delight ourselves by learning, for that very reason, by connecting with our inner child, the infographic is so effective in communicating complex information from emotion.
And to influence the visual perception that is being represented in an infographic you can take a look at the Post: “Graphic design and visual perception” …


